

BEA released its Q2 2026 GDP by state data on September 30 — along with its annual update, which revises the last several years of history for every state. I've been digging through it since (as one does), and the picture for Connecticut is worth continuing to highlight.
First, BOOM.
Connecticut is now the 7th fastest growing economy in the country, expanding at a 3.0% annualized rate. That's well ahead of the U.S. at 2.2% and the fastest in New England, where the region grew 2.5%.
$117 billion since 2019
The quarterly rankings are fun, and I'll keep posting them. But if you've been following along, you know I believe insight live in the big picture. So let's zoom out, so we can zoom in.
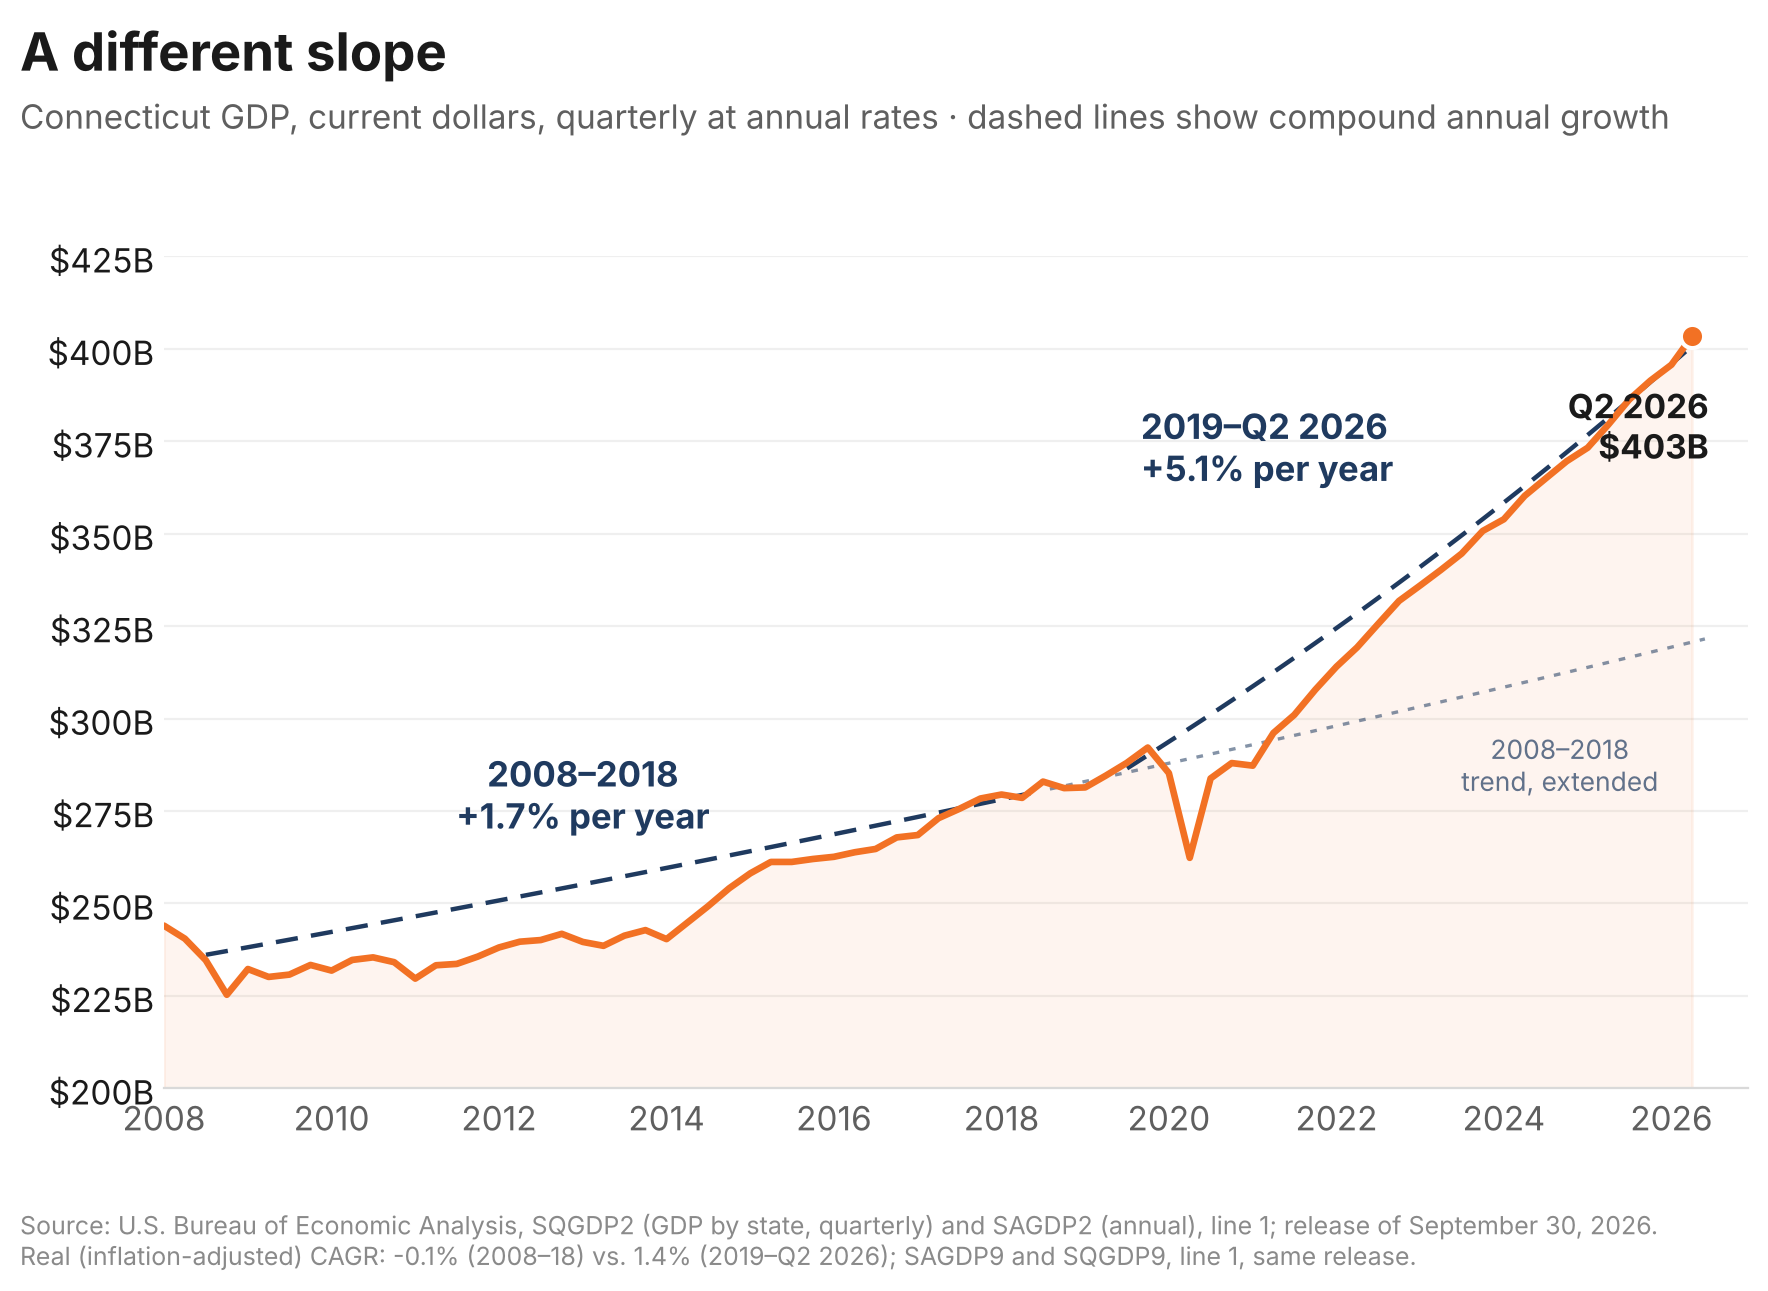
In 2019, Connecticut's economy was $287 billion. As of Q2 2026 we've reached $403 billion, adding $117 billion of new economic output in six and a half years — a 41% expansion.
But the number that matters most to me isn't the level. It's the slope.
From 2008 to 2018, Connecticut's economy grew at 1.7% per year. In real terms, so inflation adjusted for the non nerds, it shrank — down 0.1% a year over a full decade, one of the worst records in the country. Since 2019, we have compounded at 5.1% per year in nominal terms. Had we stayed on the old trend line, we'd be a ~$321 billion economy today. We're $403 billion. That gap is the difference between the Connecticut of the last decade and the Connecticut we're building now.

Where did it come from? Finance and insurance alone added $22 billion between 2019 and 2025 — growing 53% and accounting for nearly a quarter of everything we added. Real estate, health care, and professional services were the next largest contributors. It's a broad-based expansion, led by the sectors where Connecticut has real, durable competitive advantage.
What drove the quarter
Fourteen of the 23 industries BEA tracks grew in Q2. Two did most of the work.

Durable goods manufacturing (+15.2%) was the story of the quarter — more than triple the national manufacturing growth rate, and roughly 40% of Connecticut's total growth. This is our defense industrial base: Pratt, Sikorsky, Collins, Electric Boat, and the hundreds of supply chain manufacturers that work alongside them, often across generations. It's exactly the capacity we set out to protect and expand with the Strategic Supply Chain Initiative, and the latest round of awardees — new aerospace, machining, and coatings capacity in Enfield, Shelton, and Milford — are the kind of investments that show up in a number like this.
Finance and insurance (+4.9%) was the second-largest contributor. This one matters to me. Back in April I wrote that F&I — our largest sector, and the biggest single source of our growth since 2019 — had recently been growing "below its historical pace," and that we had prioritized our work at DECD to address it. Two quarters later, F&I has now posted back-to-back strong quarters: roughly 10% annualized in Q1 and 4.9% in Q2. One quarter is noise; two is a trend worth watching. I'm not claiming credit nor suggesting we are letting up, but the direction is right, and we're staying on it.
Information was the third-largest contributor to the quarter — a sector that is up more than 30% in real terms since 2019. This is why offense matters, and why we prioritize horizontals (like Quantum and AI) in how they apply to our verticals. More about applied technology in the coming months.
Real estate (+4.0%) continued its steady climb — not surprising for a state that just posted the fastest housing permit growth in America. Utilities (+7.7%) bounced back after a rough 2025. Wholesale trade (+4.1%) and health care (+2.6%) rounded out the other major contributors.
What is holding us back
The drags were concentrated. Government (−5.2%) was the largest, driven by federal and military spending — a continuation of what we've seen in recent years. Retail trade (−4.5%) and transportation and warehousing (−10.1%) declined, consistent with the national picture, where both were among the leading offsets. Nondurable goods manufacturing (−3.7%) continued its long slide, which remains the offset to the strength in durables.
The big picture
The strategy hasn't changed: defense - protect the core, and offense - invest aggressively in what's next. Q2 is what it looks like when the core performs. Our defense industrial base posted one of its strongest quarters in years, our largest sector is reaccelerating, and the economy as a whole is growing faster than the country and the region around us. Personal income tells the same story: up 5.3% in Q2, 12th in the country and the fastest in New England, with per capita income of $106,299 — the highest in the nation.
$403 billion. Seventh fastest. $117 billion since 2019.
We've got this. Join us. Connecticut is back.

Sources: U.S. Bureau of Economic Analysis, release of September 30, 2026 — SQGDP9 (Real GDP by state, quarterly) for growth rates and the state ranking; SQGDP2 and SAGDP2 (GDP by state, current dollars) and SAGDP9 (Real GDP by state, annual) for levels and compound growth; SQGDP11 (Contributions to percent change in real GDP) for industry contributions; SAGDP2 for the 2019–2025 change by industry; SQINC1 (State quarterly personal income summary) for personal income. Full data, including the all-state ranking and industry detail, is here: Q2 Detail
Quarterly growth rates are real (inflation-adjusted) and annualized; dollar levels, the $117B figure, and the industry dollar changes are current dollars.